Economy
Rye is often the only economically viable alternative crop on less fertile and sandy soils. But also on average to high yielding sites, the question of the most economical winter cereal arises again and again. Rye is not only the most withstanding and stress tolerant cereal but as hybrid variety is even able to keep up with wheat on loam soils in terms of yield and profitability.
Economy
X

–

=

In practical farming the perception shows a different picture. The reasons are obvious: Traditionally rye “feels at home” on the lightest sites. However, rye does not get the chance to exploit its full yield potential on these sites. Especially in drought years, water supply is the main problem on sandy sites putting additional pressure on the crop. To be fair, a cross-crop comparison is only possible on sites with the same soil quality and preceding crop.
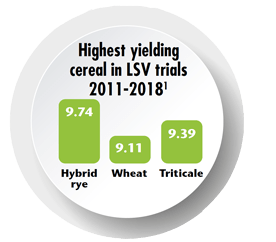
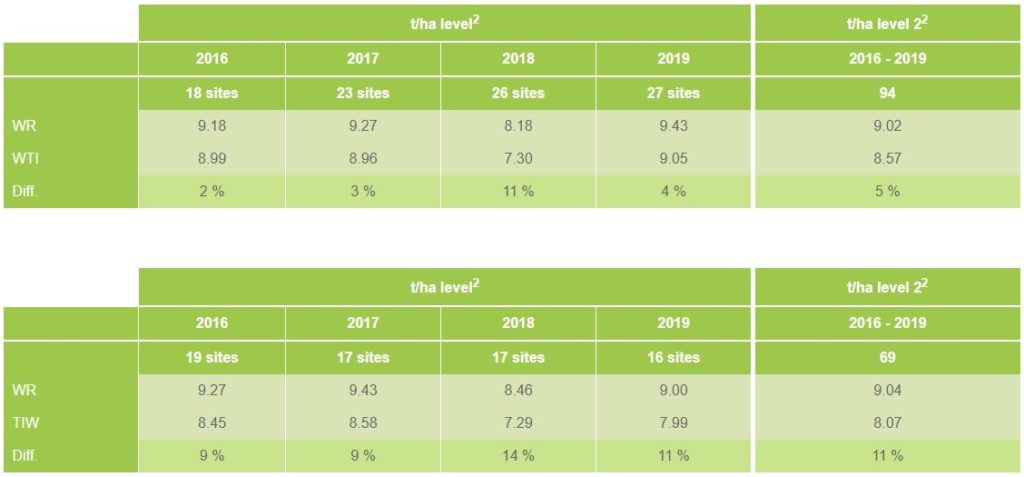
It remains to be seen whether the current increase in area – due to the displacement of winter wheat and/or triticale – is the beginning of a rye comeback or not. Fact is that perennial LSV (federal state variety trials) results impressively prove the yield superiority of rye. On comparable sites in regard to soil quality and preceding crop rye shows across Germany a mean yield increase of 11 % compared to wheat and of 5 % compared to triticale. Compared to second wheat rye succeeds up to 20 % higher yields.
LSV 1 evaluation WR, WTI, WW 2016-2019
t/ha level2
t/ha level 22
-
2016
2017
2018
2019
2016 - 2019
-
18 sites
23 sites
26 sites
27 sites
94
WR
9.18
9.27
8.18
9.43
9.02
WTI
8.99
8.96
7.30
9.05
8.57
Diff.
2 %
3 %
11 %
4 %
5 %
t/ha level2
t/ha level 22
-
2016
2017
2018
2019
2016 - 2019
-
19 sites
17 sites
17 sites
16 sites
69
WR
9.27
9.43
8.46
9.00
9.04
TIW
8.45
8.58
7.29
7.99
8.07
Diff.
9 %
9 %
14 %
11 %
11 %
1 Federal state variety trials of Germany
2 Trials are carried out with growth regulators and fungicide treatments
1 Federal state variety trials of Germany
2 Trials are carried out with growth regulators and fungicide treatments
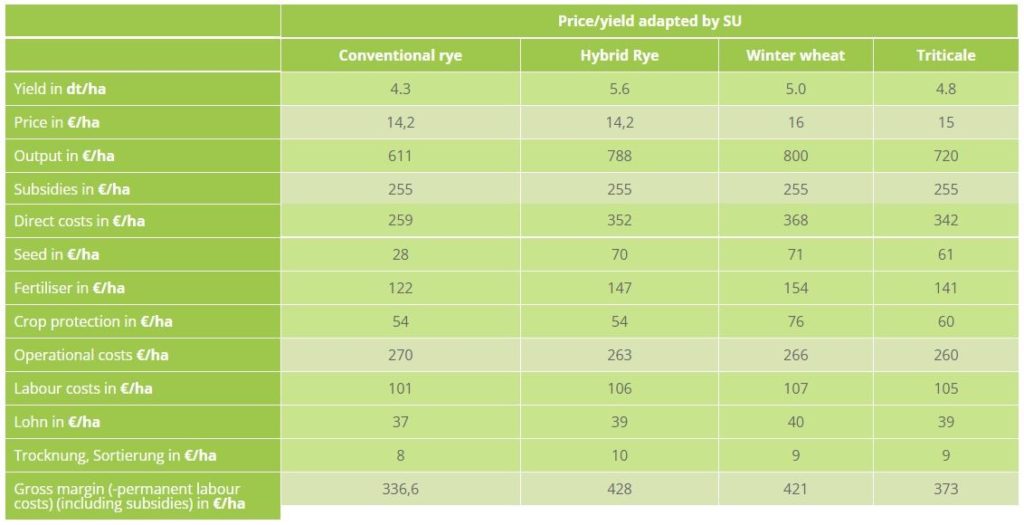
Of course yield is only one side of the story. At the end of the day only the gross margin counts. The data basis for the calculations is provided by the “Data Collection for Farm Planning and the Economic Evaluation of Agricultural Production Methods” of the Ministry of rural development, environment and agriculture of the federal state Brandenburg (LELF). With a special focus on sites with 29 to 36 soil points (German soil classification) it becomes clear that hybrid rye can be an economic alternative.
At first glance on the basis of gross margin (– permanent labour costs) (DAL) wheat seems to be clearly ahead. However, the LELF assumes between wheat and rye a very big difference in price and a small difference in yield. The long-term average price difference between bread-making rye and wheat is about 22.0 EURO/t (AMI). Based on the LSV result evaluation a yield advantage of 11 % can be assumed. If these figures are adjusted it becomes clear that hybrid rye is also on loam soils on a par with wheat.More deta
Profability calculation for soils with medium yield expectations
Price/yield adapted by SU
Conventional rye
Hybrid Rye
Winter wheat
Triticale
Yield in dt/ha
4.3
5.6
5.0
4.8
Price in €/ha
14,2
14,2
16
15
Output in €/ha
611
788
800
720
Subsidies in €/ha
255
255
255
255
Direct costs in €/ha
259
352
368
342
Seed in €/ha
28
70
71
61
Fertiliser in €/ha
122
147
154
141
Crop protection in €/ha
54
54
76
60
Operational costs €/ha
270
263
266
260
Labour costs in €/ha
101
106
107
105
Lohn in €/ha
37
39
40
39
Trocknung, Sortierung in €/ha
8
10
9
9
Gross margin (-permanent labour costs) (including subsidies) in €/ha
336,6
428
421
373
Data collection for farm management and economic evaluations of agricultural production systems in the federal state of Brandenburg (LVLF 2016).
Marketing Strategy
For several years now agricultural enterprises have experienced the impact of market globalisation. In major crops such as oilseed rape and wheat domestic market prices have long ceased to be determined solely by local market conditions.
Rye, however, still remains predominantly a regional product. The global exchange of goods and thus, its significance for price formation is still of great importance.
Consequently, a production that clearly exceeds human consumption quickly leads to decreasing prices. Rye is increasingly accepted as animal feed. There is a constant demand for rye as foodstuff as it is very popular amongst consumers. Those who want to process and eat rye flour are also prepared to spend more money. If there is a shortage in supply the wheat price is no longer the benchmark and the consumer is prepared to pay prices above wheat level.
Consequently, rye prices cannot always be quoted on the basis of the wheat price. A reliable prediction is not possible. Various market analyses can help to form one‘s own opinion.
Marketing planning is not all about maximising sales. It is about choosing marketing and use strategies that cover costs and ensure liquidity. Especially as there are many possibilities to use rye the question of the best farmspecific utilisation strategy arises.
Feeding or Selling
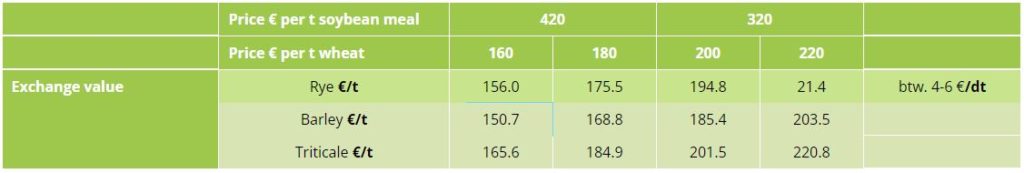
Like anything else, when goods are sold there are advantages and disadvantages to every marketing strategy. Timing of sales depends very much on operational factors like liquidity, risk and storage capacity. Rye is often sold at harvest due to lacking storage capacity. There is no sales volume risk but there is the risk of price volatility. Prices at harvest are often affected by harvest conditions. Storing rye should be considered if storage facilities are available. Livestock farms have to decide whether to feed or sell their home-grown rye or to purchase rye for feeding. There is a simple method to approach this topic – the calculation of the reference value (value for money according to Löhr). The calculation of the exchange value refers to energy density and the first limiting amino acid, the digestible lysine as well as the current market price.
Example: At a wheat market price of 180.0 Euro/t the exchange value of rye is 175.5 Euro/t. At this price rye is equivalent in regard to the main feed value characteristics. If the market price is higher rye should be sold. The average price difference is rather at 20 to 30 Euro/t. In pig fattening it makes sense in any case to feed home-grown rye in order to save feed costs.
The rye calculator helps with the decision:
SAATEN-UNION offers a new digital service: With the SU-Rye Calculator pig farmers can check very easily the economic value of different crop rotations and feeding strategies.
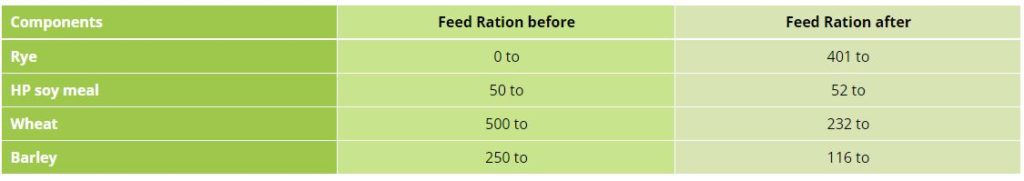
The Rye Calculator recommends farm-specifically how the rye harvest can be optimally used taking into account profitability, livestock and sustainability.
Components
Feed Ration before
Feed Ration after
Rye
0 to
401 to
HP soy meal
50 to
52 to
Wheat
500 to
232 to
Barley
250 to
116 to
For the same energy and pc-Lysin content a higher or lower feed amount could be possible.
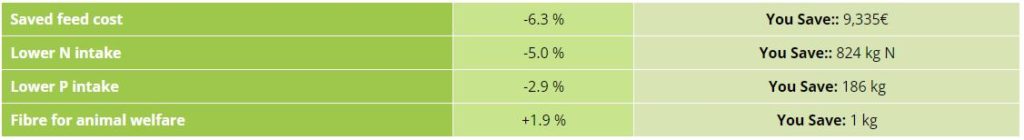
Your benefit with more rye (example calculation):
Saved feed cost
-6.3 %
You Save:: 9,335€
Lower N intake
-5.0 %
You Save:: 824 kg N
Lower P intake
-2.9 %
You Save: 186 kg
Fibre for animal welfare
+1.9 %
You Save: 1 kg
Farmers can save even more P and N with free Amino acids.
Saving Costs
Exchange value according to Löhr: Energy density (MJ ME/kg) and SIDLys (g/kg) remain equivalent in regard to the main feed value properties.
Saving Costs
Price € per t soybean meal
420
320
Price € per t wheat
160
180
200
220
Exchange value
Rye €/t
156.0
175.5
194.8
21.4
btw. 4-6 €/dt
.
Barley €/t
150.7
168.8
185.4
203.5
.
Triticale €/t
165.6
184.9
201.5
220.8
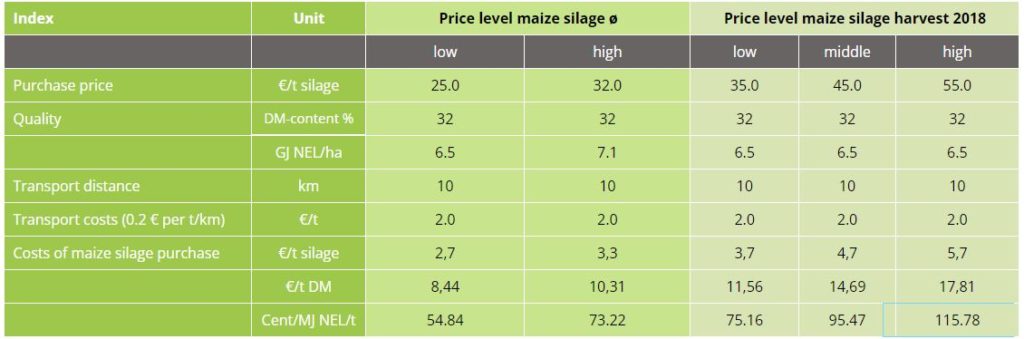
Grain or whole crop?
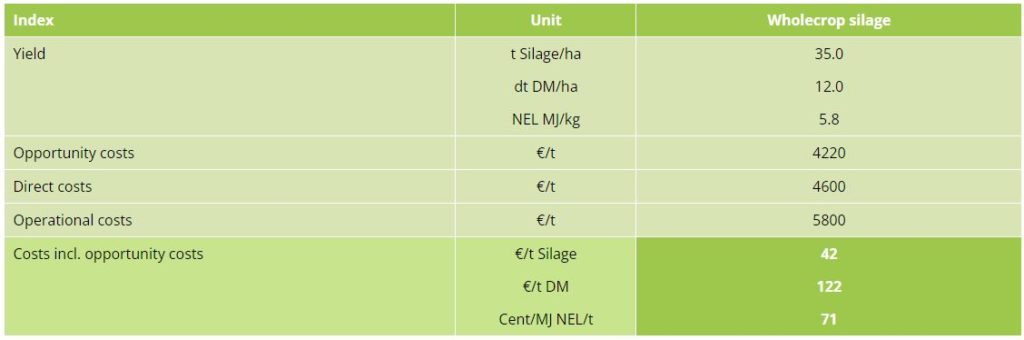
In the case of feed shortage wholecrop rye silage can be a lucrative option. The question if this year rye is used for silage or harvested is mainly influenced by market prices, the gross margin (– permanent labour costs) of the cash crop, farm individual costs for the alternative use as wholecrop and the purchasing price of forage. Wholecrop rye silage can be valuable roughage if forage harvesting and ensiling were carried out according to good agricultural practice. For more information and further details please check the online article
Costs of Silage Use (Hybrid Rye)
Index
Unit
Wholecrop silage
Yield
t Silage/ha
35.0
-
dt DM/ha
12.0
-
NEL MJ/kg
5.8
Opportunity costs
€/t
4220
Direct costs
€/t
4600
Operational costs
€/t
5800
Costs incl. opportunity costs
€/t Silage
42
-
€/t DM
122
-
Cent/MJ NEL/t
71
Source: LELF, KTBL self-estimation
Purchase Price and Transport Costs
Index
Unit
Price level maize silage ø
Price level maize silage harvest 2018
.
.
low
high
low
middle
high
Purchase price
€/t silage
25.0
32.0
35.0
45.0
55.0
Quality
DM-content %
32
32
32
32
32
.
GJ NEL/ha
6.5
7.1
6.5
6.5
6.5
Transport distance
km
10
10
10
10
10
Transport costs (0.2 € per t/km)
€/t
2.0
2.0
2.0
2.0
2.0
Costs of maize silage purchase
€/t silage
2,7
3,3
3,7
4,7
5,7
.
€/t DM
8,44
10,31
11,56
14,69
17,81
.
Cent/MJ NEL/t
54.84
73.22
75.16
95.47
115.78